OPC UA Book
 The first OPC Unified Architecture Book, written by Wolfgang Mahnke, Stefan-Helmut Leitner and Matthias Damm one of the co-founders of ascolab.
OPC UA Network Protocol Analyzer
ascolab has enabled the most commonly used network protocol analyzer called "Wireshark" for OPC UA protocol decoding.
About Wireshark
Wireshark® is the world's most popular network protocol analyzer. It has a rich and powerful feature set and runs on most computing platforms including Windows, OS X, Linux, and UNIX. Network professionals, security experts, developers, and educators around the world use it regularly. It is freely available as open source, and is released under the GNU General Public License version 2.
Wireshark used to be known as Ethereal®. If you're still using Ethereal, it is strongly recommended that you upgrade to Wireshark.
OPC UA Plugin for Wireshark (SVN > 1.1.4 - 28168)
The OPC UA protocol analyzing is integrated in the latest build of Wireshark and will be part of the next official release. If you want to start right now you can download the latest build (Stable Release 1.2.1). The Win32 setup version can be found here:
http://www.wireshark.org/download.html
How to Use Wireshark
This gives a very short step-by-step instruction to demonstrate how to use Wireshark for OPC UA protocol analyzing.
- After download, install Wireshark and follow the on screen instructions
- Start Wireshark
- Configure the Protocol Preferences (add Ports you want to capture)
- Select your network card and configure the Capture Filter
- Start Capturing
If you now start your OPC UA Server and connect with your Client, you will capture all service calls on the network. After performin the actions you want to capture, stop the Wireshark capturing. You can now set "Display Filters" to reduce the view an all the captured information.
Example
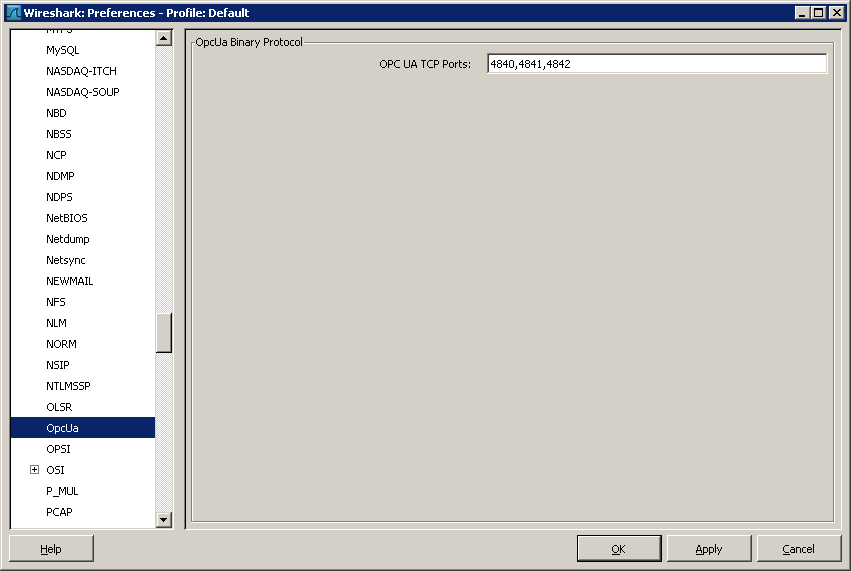
First set the OPC UA ports you want to capture by setting the Wireshark Preferences
Edit -> Preferences -> select Protocols -> scroll down to OPC UA -> enter all the prots you need separated by "," comma.
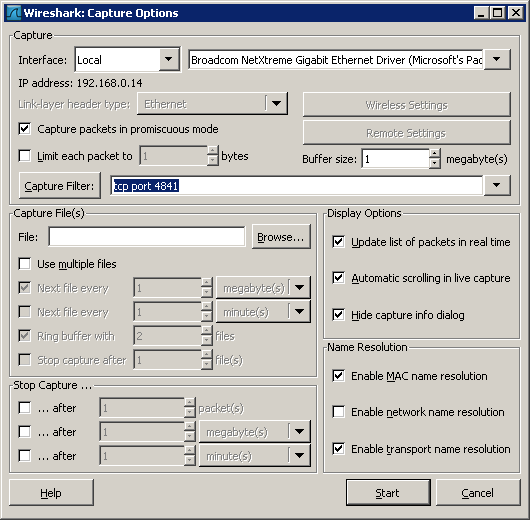
Than set the capture filter on "tcp" all or set it on TCP including a dedicated Port "tcp port 4841"
Capture -> Options -> select your network card -> select your capture filter
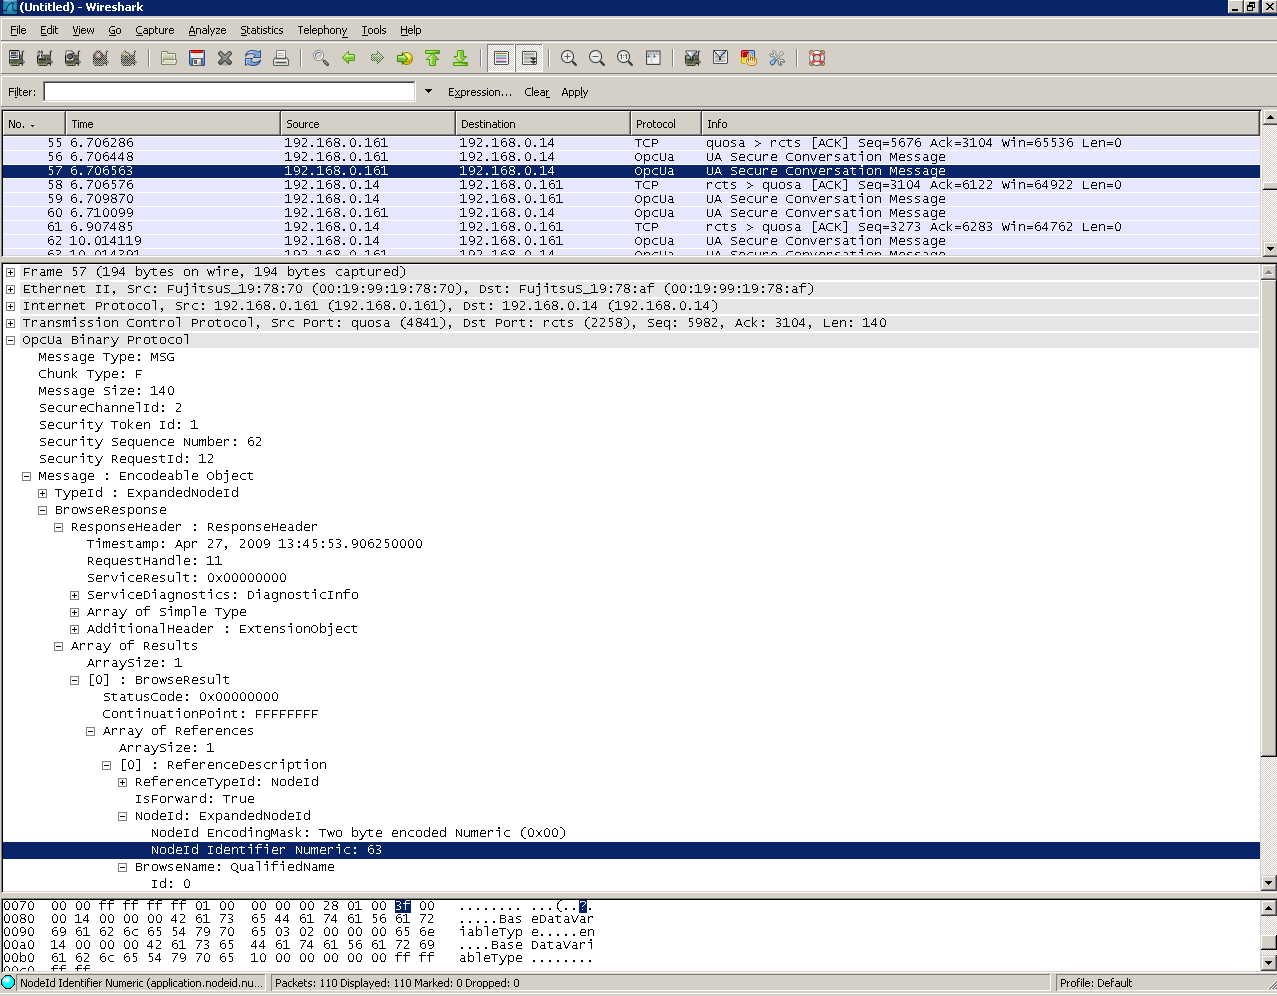
The result is displayed in the main window having tree horizontal sections. The first upper section shows the individual telegram including timestamp and direction (source to destination). When selecting a certain message it's content can be expanded in the window below. In the example you can see a response sent from the server to the client that was returned on a call of the Browse Service. The content of all objects can be decoded; in addition the lowest window pane shows the hexadecimal view for the selected item.
")
")